New Horizons
 Project Management Academy
 Six Sigma Online
 TCM Security
 TRACOM
 Velopi
 Watermark Learning
 Login
Login


For anyone taking a PMP© exam preparation course, the section on Project Schedule Management can be very confusing. Experienced project managers have invariably come across Microsoft Project and are used to presenting schedules in the form of a Gantt chart. Picture their surprise when their PMP© course instructor keeps talking about precedence diagramming methods and activity-on-node graphs, but never mentions the Gantt chart. Even if the PMP© exam student searches the Project Management Institute’s Guide to the Project Management Body of Knowledge (PMBOK© Guide), they will find Gantt charts mentioned as an example of a bar chart.
On this page:
- Understanding the Gantt Chart: A Key Tool in Project Schedule Management
- Microsoft Project: Leveraging the Gantt Chart and Network Diagram Format
- Incorporating PMP® Concepts: Critical Path and Earned Value Management in Microsoft Project
- Enhancing Project Schedule Management with PMP® Training
Understanding the Gantt Chart: A Key Tool in Project Schedule Management
The first thing to appreciate about the Gantt chart is that it is a Gantt chart, not a GANTT chart. It is named after its creator, Henry Lawrence Gantt, who came up with the format about a century ago. Although a Polish economist named Karol Adamiecki developed something similar in 1896, he published his work in Polish, which limited its dissemination.
Microsoft Project: Leveraging the Gantt Chart and Network Diagram Format
Because of its use in Microsoft Project, the Gantt chart has become very popular in project management circles. Indeed job vacancies for project managers regularly feature a requirement for expertise in Microsoft Project, though rarely one for the critical path method. All this might suggest that the Project Management Institute is behind the curve, but its approach to training PMPs© in scheduling makes sense. Knowing the underlying theory makes applying it to Gantt charts or any other representation easy.
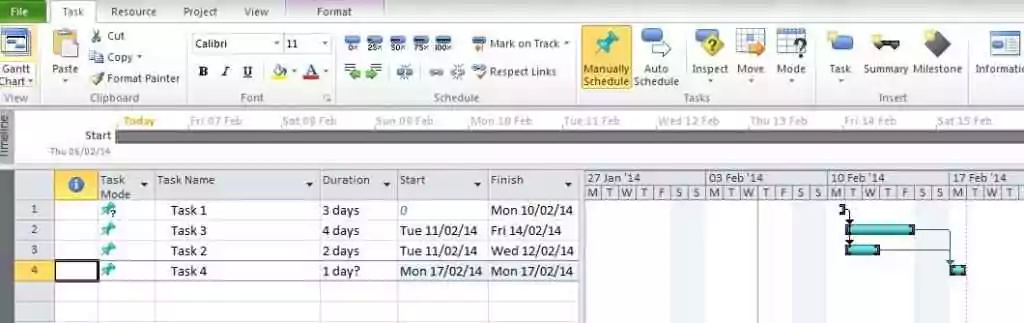
Although Microsoft Project defaults to Gantt chart format, anyone with PMP© project management certification can remain true to their precedence diagram method roots by entering data in network diagram format.
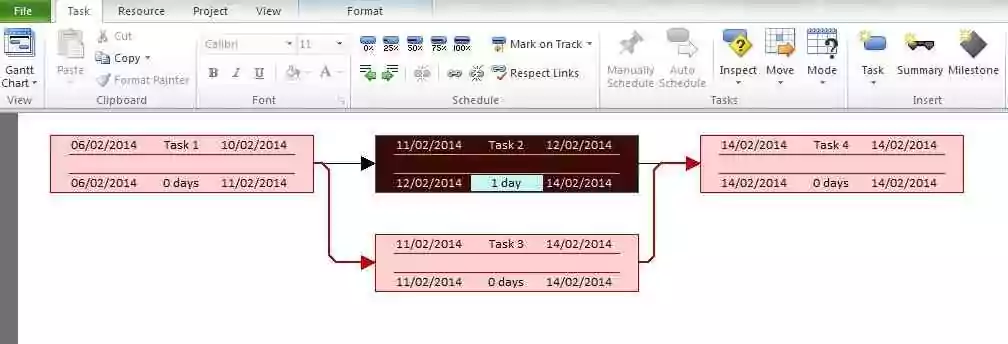
What is really appealing about this tool is the way it calculates the critical path for you – no more labouring over forward and backward passes, just consider the pink nodes on the chart. Another nice thing is that when you are finished creating the network diagram, you can select the Gantt chart view from the menu and distribute it to the team in the more familiar format.
Incorporating PMP® Concepts: Critical Path and Earned Value Management in Microsoft Project
While it is nice to have the critical path calculated for you, PMPs© might want to see the familiar fields from our PMP© exam days. Microsoft Project allows you to display these on the Gantt chart view.
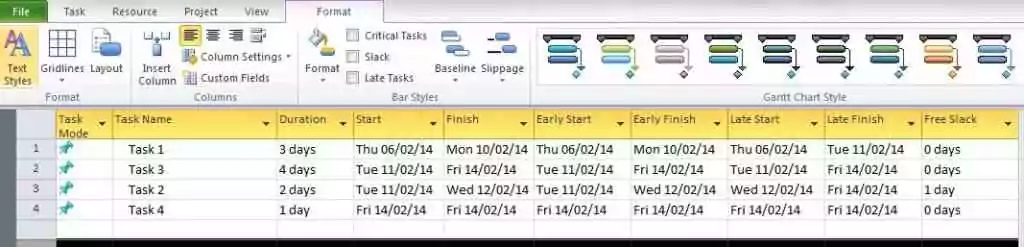
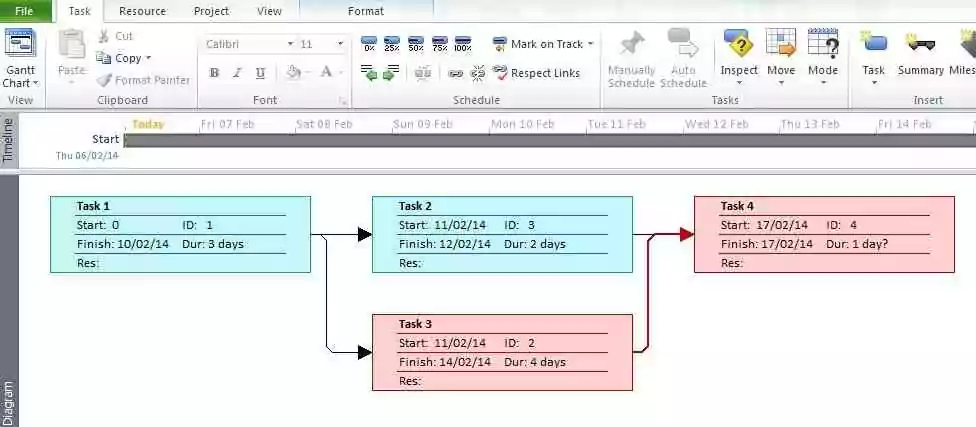
It also allows you to redesign the network nodes, so that they reflect the nodes you used during your PMP© training. So we can see our old friends Early Start, Early Finish, Late Start, Late Finish and Free Float again.
Microsoft Project also allows you to incorporate Earned Value Management into your schedules. Strangely enough, it uses the old-fashioned terms – Budgeted Cost of Work Scheduled (Planned Value), Budgeted Cost of Work Performed (Earned Value) and Actual Cost of Work Performed (Actual Cost).
Enhancing Project Schedule Management with PMP® Training
Although Microsoft Project is a non-trivial piece of software, knowing what you want to do with it – thanks to your PMP© exam preparation work – will help you get around its complexity.
Although our PMP© courses do not cover Microsoft Project, they will provide excellent understanding of the critical path method. We hold our courses online in a virtual classroom for your convenience. Please visit our training page, or contact us directly, for more details.